Candlestick charts are one of the most popular forms of technical analysis used by traders to make profitable trades in financial markets. They offer traders an easy-to-understand visual representation of market movements, making it easier to spot trends and predict future price movements. In this article, we will explore how to make money trading with candlestick charts.
Understanding Candlestick Charts
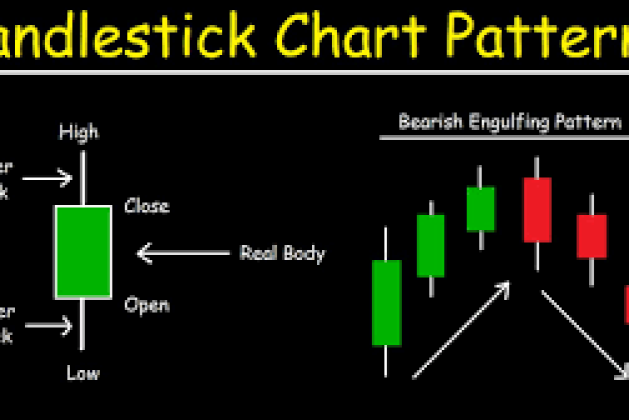
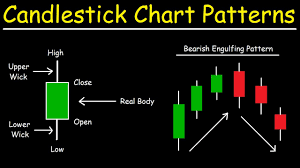
Candlestick charts were first developed by Japanese rice traders in the 18th century. They were used to track the price of rice and other commodities and were later adopted by traders in other financial markets. A candlestick chart shows the open, high, low, and close prices for a given time period, typically a day, week, or month. Each candlestick on the chart represents a single trading session.
The body of the candlestick represents the price range between the open and close prices. The color of the candlestick indicates whether the market closed higher (green or white) or lower (red or black) than it opened. The wicks or shadows on the top and bottom of the candlestick show the range of prices that occurred during the trading session.
Candlestick Chart Patterns
One of the keys to making money trading with candlestick charts is understanding the various patterns that can occur. These patterns provide clues as to the future direction of the market and can help traders make informed decisions. Some of the most common candlestick patterns include:
Bullish Engulfing Pattern: This pattern occurs when a small red candlestick is followed by a larger green candlestick that completely engulfs the previous day’s candlestick. This is a bullish signal indicating that the market is likely to move higher.
Bearish Engulfing Pattern: This pattern is the opposite of the bullish engulfing pattern. It occurs when a small green candlestick is followed by a larger red candlestick that completely engulfs the previous day’s candlestick. This is a bearish signal indicating that the market is likely to move lower.
Doji: A Doji candlestick has a very small body and long wicks or shadows. This indicates that the market opened and closed at nearly the same price. Doji candlesticks can be either bullish or bearish depending on their location in the chart.
Hammer: A hammer candlestick has a long lower shadow and a small body near the top of the candlestick. This indicates that the market opened lower but closed higher, and is a bullish signal.
Shooting Star: A shooting star candlestick has a long upper shadow and a small body near the bottom of the candlestick. This indicates that the market opened higher but closed lower, and is a bearish signal.
Trading Strategies with Candlestick Charts
There are many different trading strategies that can be used with candlestick charts. One of the most popular is the trend-following strategy. This strategy involves identifying the direction of the trend and entering trades in the same direction. For example, if the market is in an uptrend, traders would look for bullish candlestick patterns to enter long positions.
Another strategy is the reversal strategy. This strategy involves identifying potential reversals in the market and entering trades in the opposite direction. For example, if the market is in an uptrend and a bearish engulfing pattern occurs, traders would look to enter short positions.
Risk Management
As with any trading strategy, it is important to have a solid risk management plan in place when trading with candlestick charts. Traders should always use stop-loss orders to limit their potential losses in case the market moves against them. They should also be mindful of their position sizing, only risking a small percentage of their trading account on each trade.
In conclusion, candlestick charts can be a powerful tool for traders looking to make profitable trades in financial markets. By understanding candlestick patterns, using appropriate trading strategies, and managing risk, traders can increase their chances of success. It takes time and effort to become proficient in trading with candlestick charts, but the potential rewards can be significant.


Leave a comment